SafeBreach Flexible Dashboards for Comprehensive Reporting, Accountability of Cybersecurity
One of the greatest challenges faced by CISOs is translating security and operational data to reflect business goals and objectives in a coherent way. Doing so is critical in achieving alignment on goals and the establishment of key performance indicators (KPIs). Even more crucially, executives and stakeholders need visibility into ongoing operational and security risks if in order to make the right decisions to minimize risk and to understand the impact of their decisions, in near real-time.

Build Rich Visualizations of Any Security Aspect In A Few Clicks
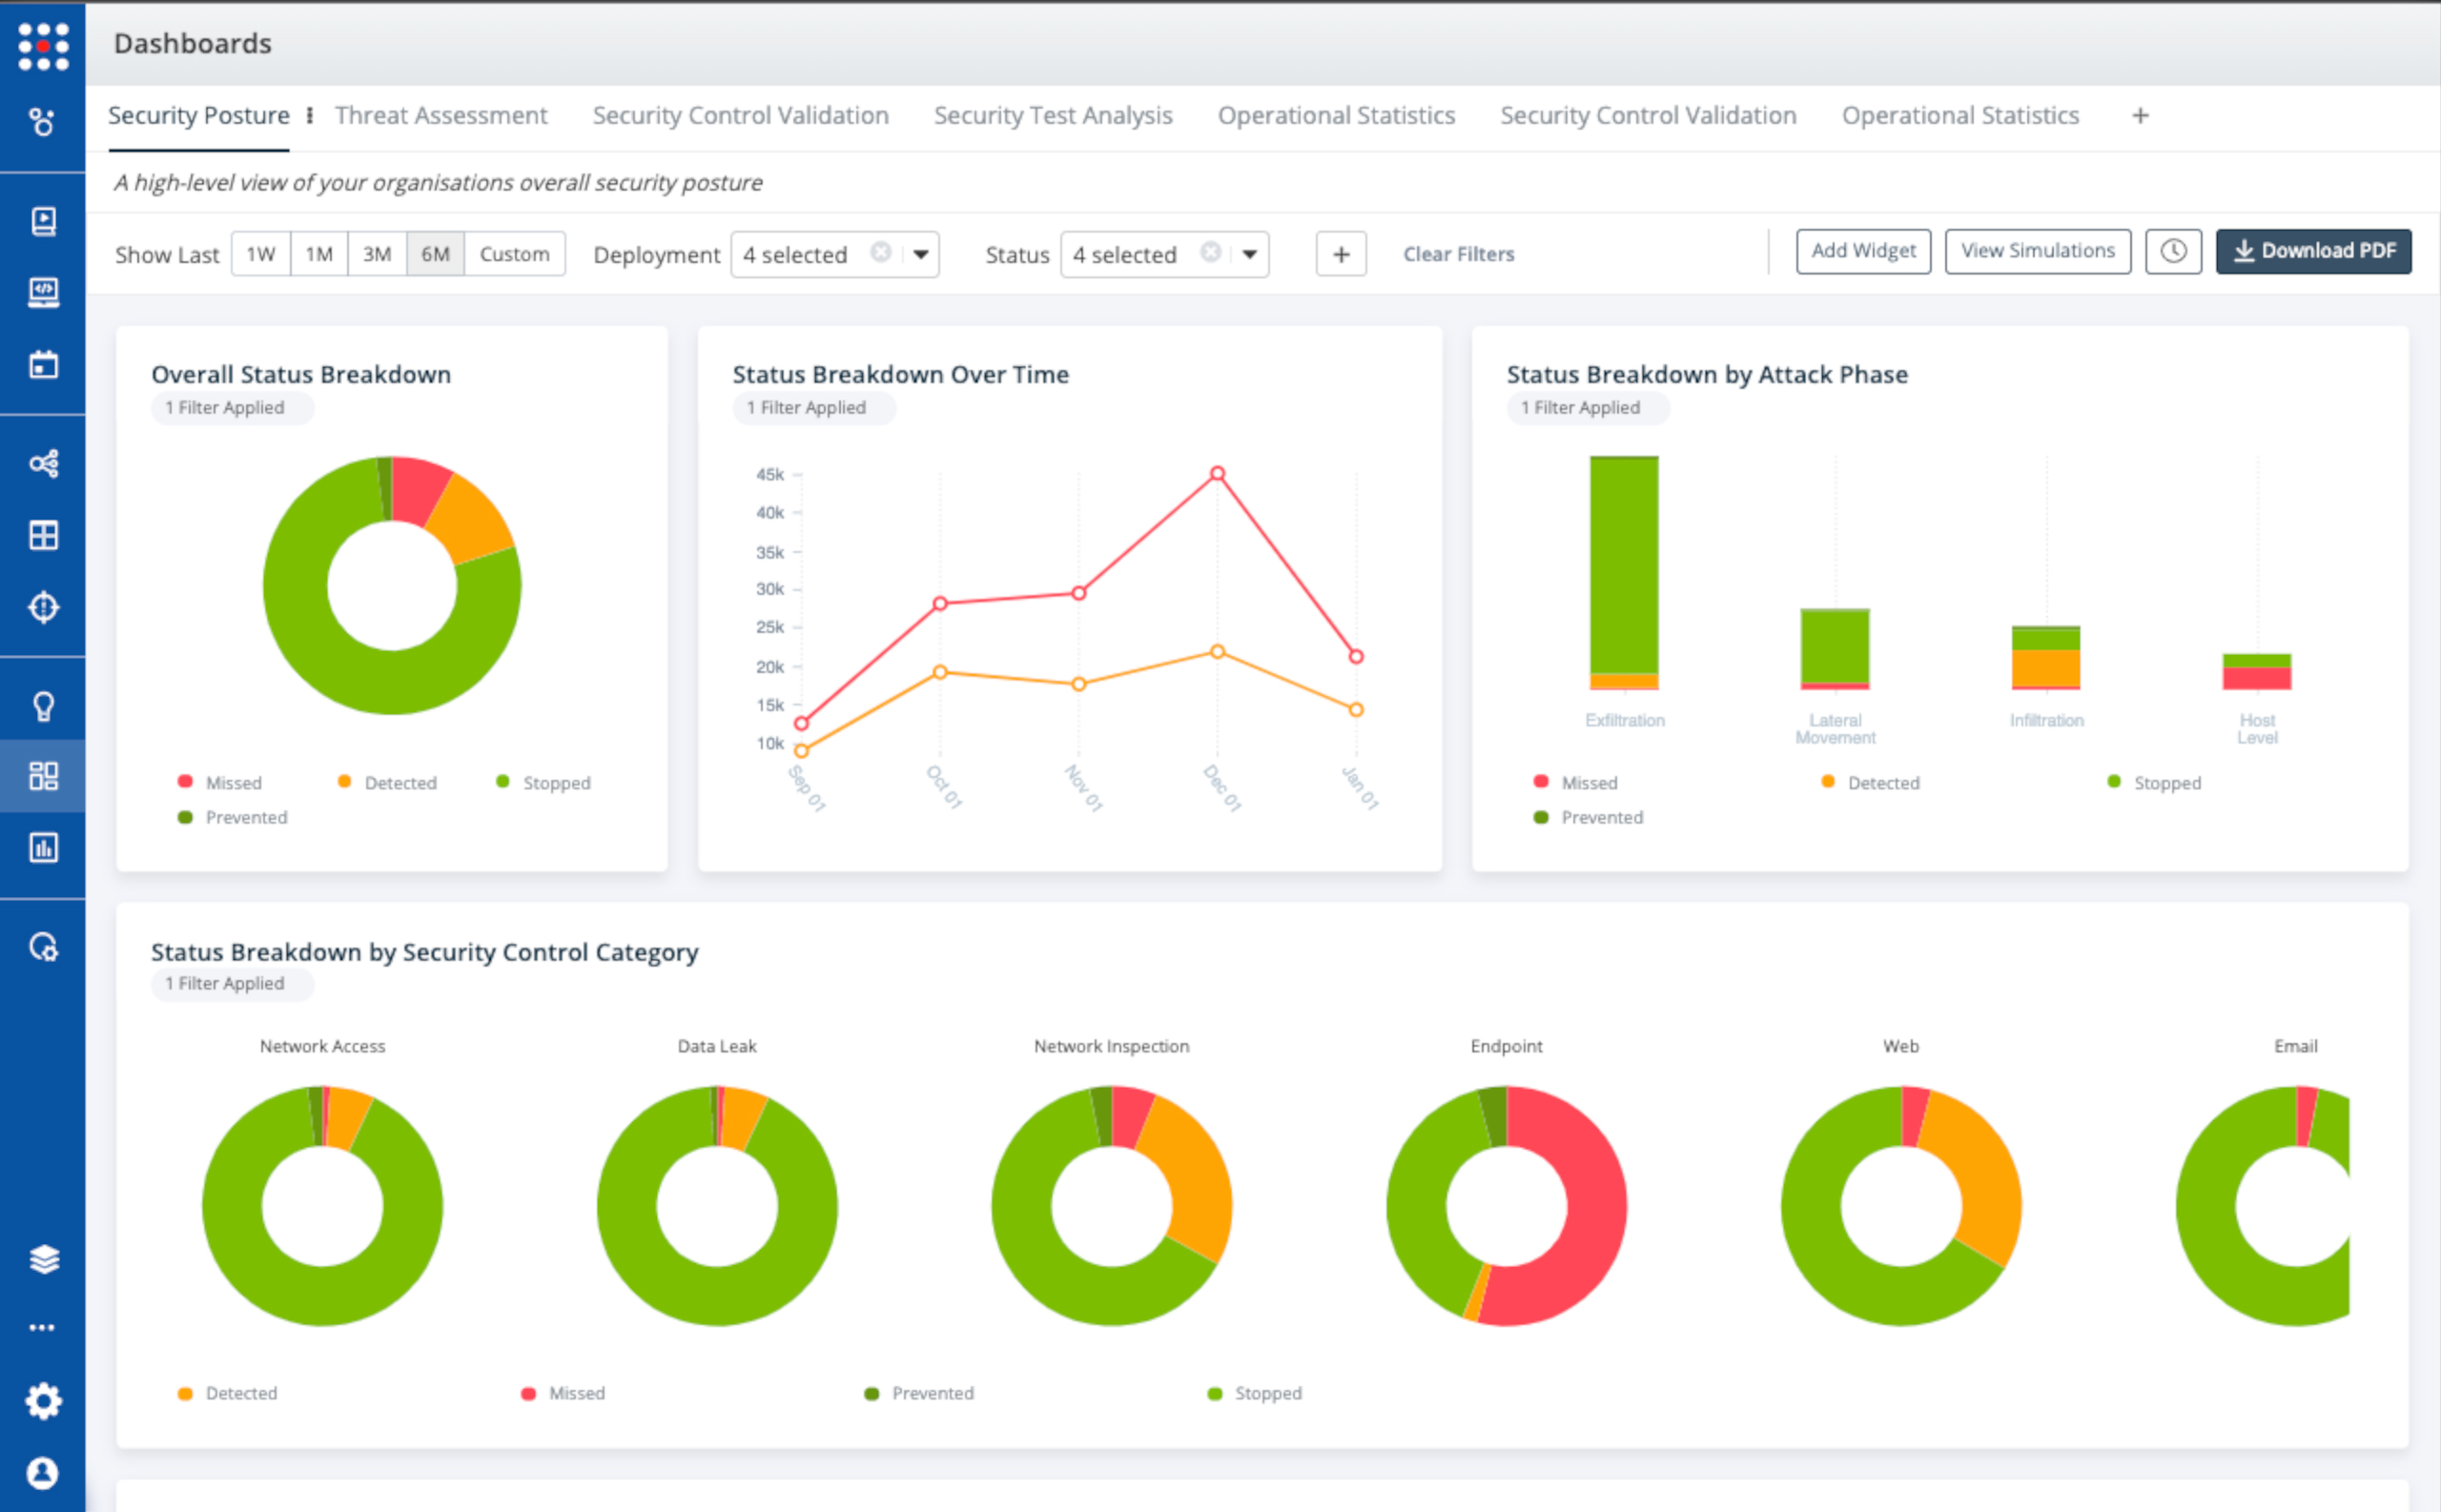
Flexible Dashboards is a comprehensive reporting infrastructure that allows our users to visualize and report on any security and risk metrics measured by the SafeBreach platform. With Flexible Dashboards, CISOs and security leads can build dashboards with rich charts and graphs in a few clicks or tap into a growing library of pre-configured dashboards and widgets for well-known metrics.
Why Flexible Dashboards Drive Better Focus, Better Business Results
The smartest organizations understand that focus is the key to effective security and risk reduction. Even the best security teams with the best controls cannot offer 100% protection against every attack. Once an organization deploys SafeBreach, they gain the revolutionary ability to test the security infrastructure continuously. This allows them to validate assumptions and generate reliable and objective metrics that can be used for strong KPIs that track not only security resilience but also broader business outcomes. Making security stance measurable and visible enables laser focus on the right actions and remediations. More focus also drives smarter investment, either in manpower or changes to controls.
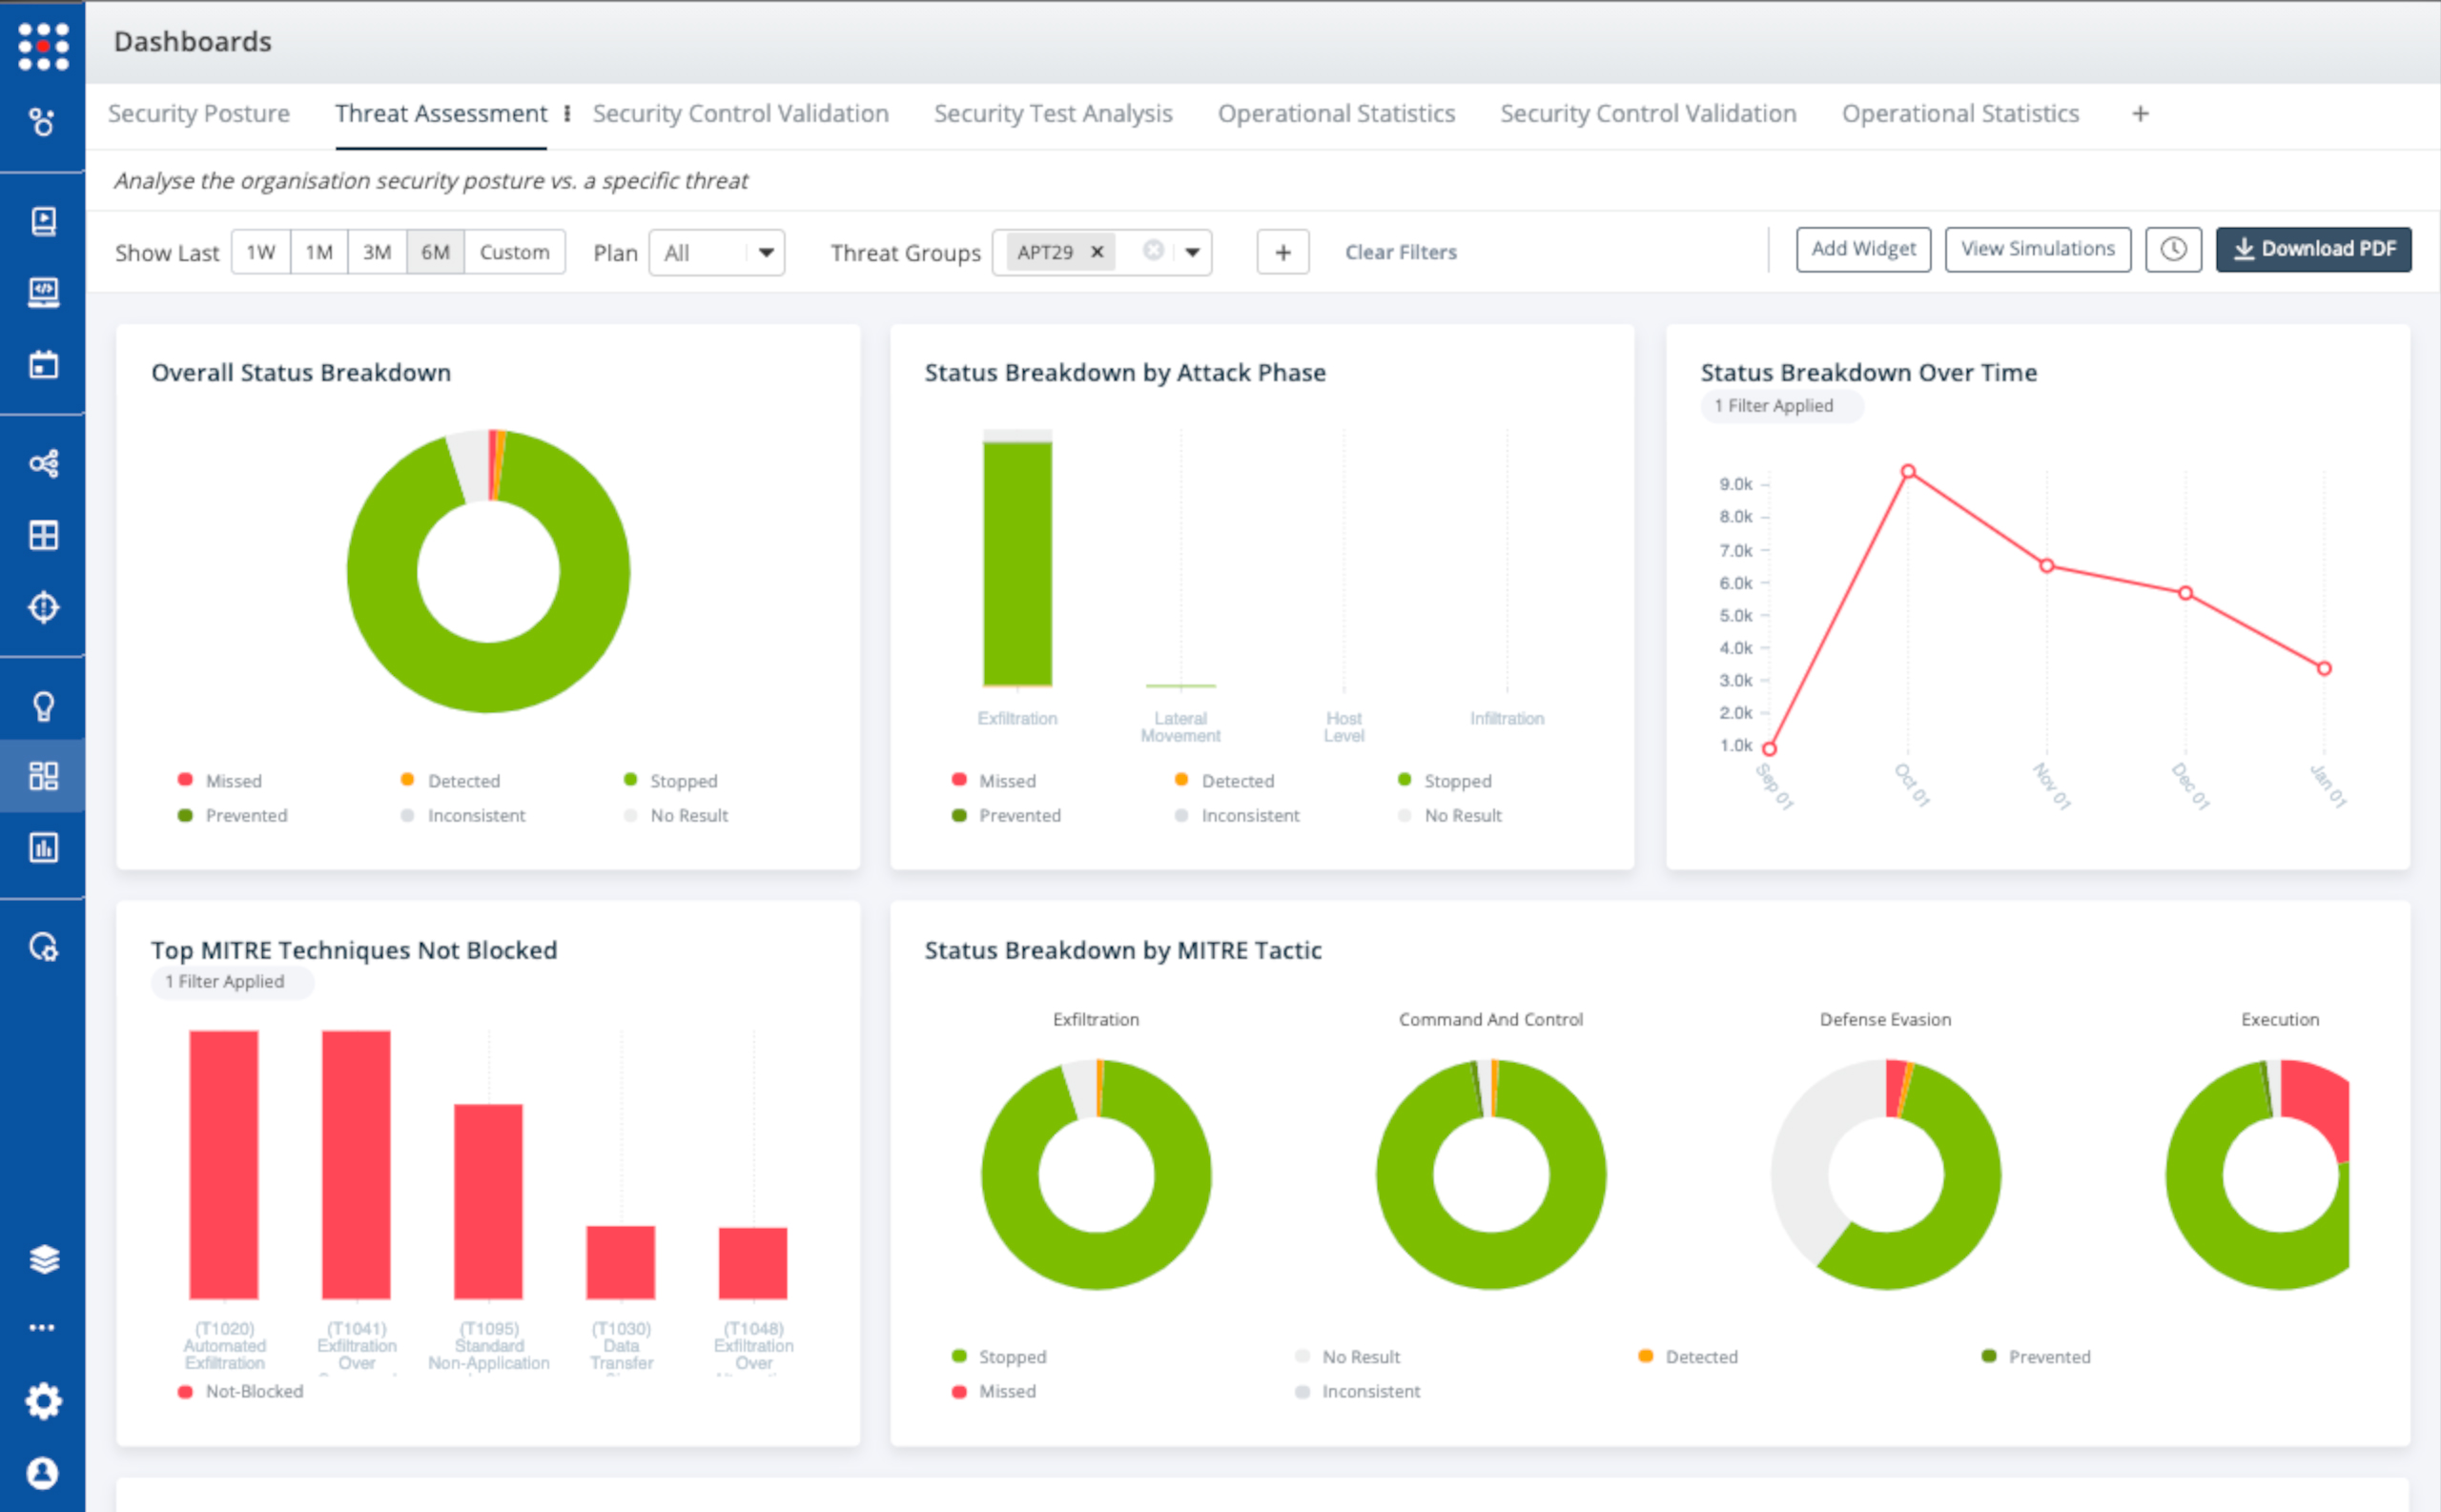
Flexibility enables focus, which is why we built dashboards to be extremely flexible. Flexibility in how security is visualized and reported is crucial to aligning stakeholders with security and business goals and providing them with the right information view to drive their actions. Having the flexibility to measure and report on the metrics that matter for a specific stakeholder or role enables everyone to focus on the right things and undertake the actions that move the needle on metrics and KPIs. For example, a Director of IT may benefit from insights as to what percentage of users have deployed VPNs for remote work but would not need to know whether a new Advanced Persistent Threat technique could crack a network firewall. A security team analyst focusing on threat analysis would benefit from understanding which APT techniques are not well covered by security controls and how many of the highest priority APT playbooks are blocked at any given point in time. Flexible dashboards accommodate these types of differences, and much more.
Export, Share Dashboards to Customize Stakeholder Views
Flexible Dashboards is a complete dashboard and reporting infrastructure designed for customization, sharing and publication. Any dashboard can be exported, embedded or shared. This allows for numerous potential views of security stance and risk metrics, customized to stakeholder role and responsibility. With our dashboards, reporting and tracking KPIs as business goals facilitates effective communication between security and business. It also aligns security investment to maximize business impact results by clarifying focus on the right areas and managing security budgets effectively and efficiently.
How Customers Are Using SafeBreach Flexible Dashboards
Our customers are already embracing Flexible Dashboards to:
- Generate reporting and tracking based on Business Unit, Threat Assessment, Security Control Validation and Asset Protected.
- Combine various data points to visualize key security program metrics including Security Controls, Software Vulnerabilities, MITRE ATT&CK TTPs and threat information.
- Track security KPIs at the stakeholder, BU and organization-wide altitude both over time and in real-time.
Some specific use cases of SafeBreach customers include:
- Large insurance provider performs security posture assessment by Business Unit: Results, including security control actions and detection prevention analysis, are published in a dashboard and reported quarterly to the CISO and the Board of Directors as KPIs.

- Large health care organization reports security stance against APT29, and other threat actors: The organization tracks their security program and testing against specific MITRE ATT&CK Threat Actors, monitoring miss rate over time, identifying top techniques to remediate going forward, and streamlining security area investment and prioritization.

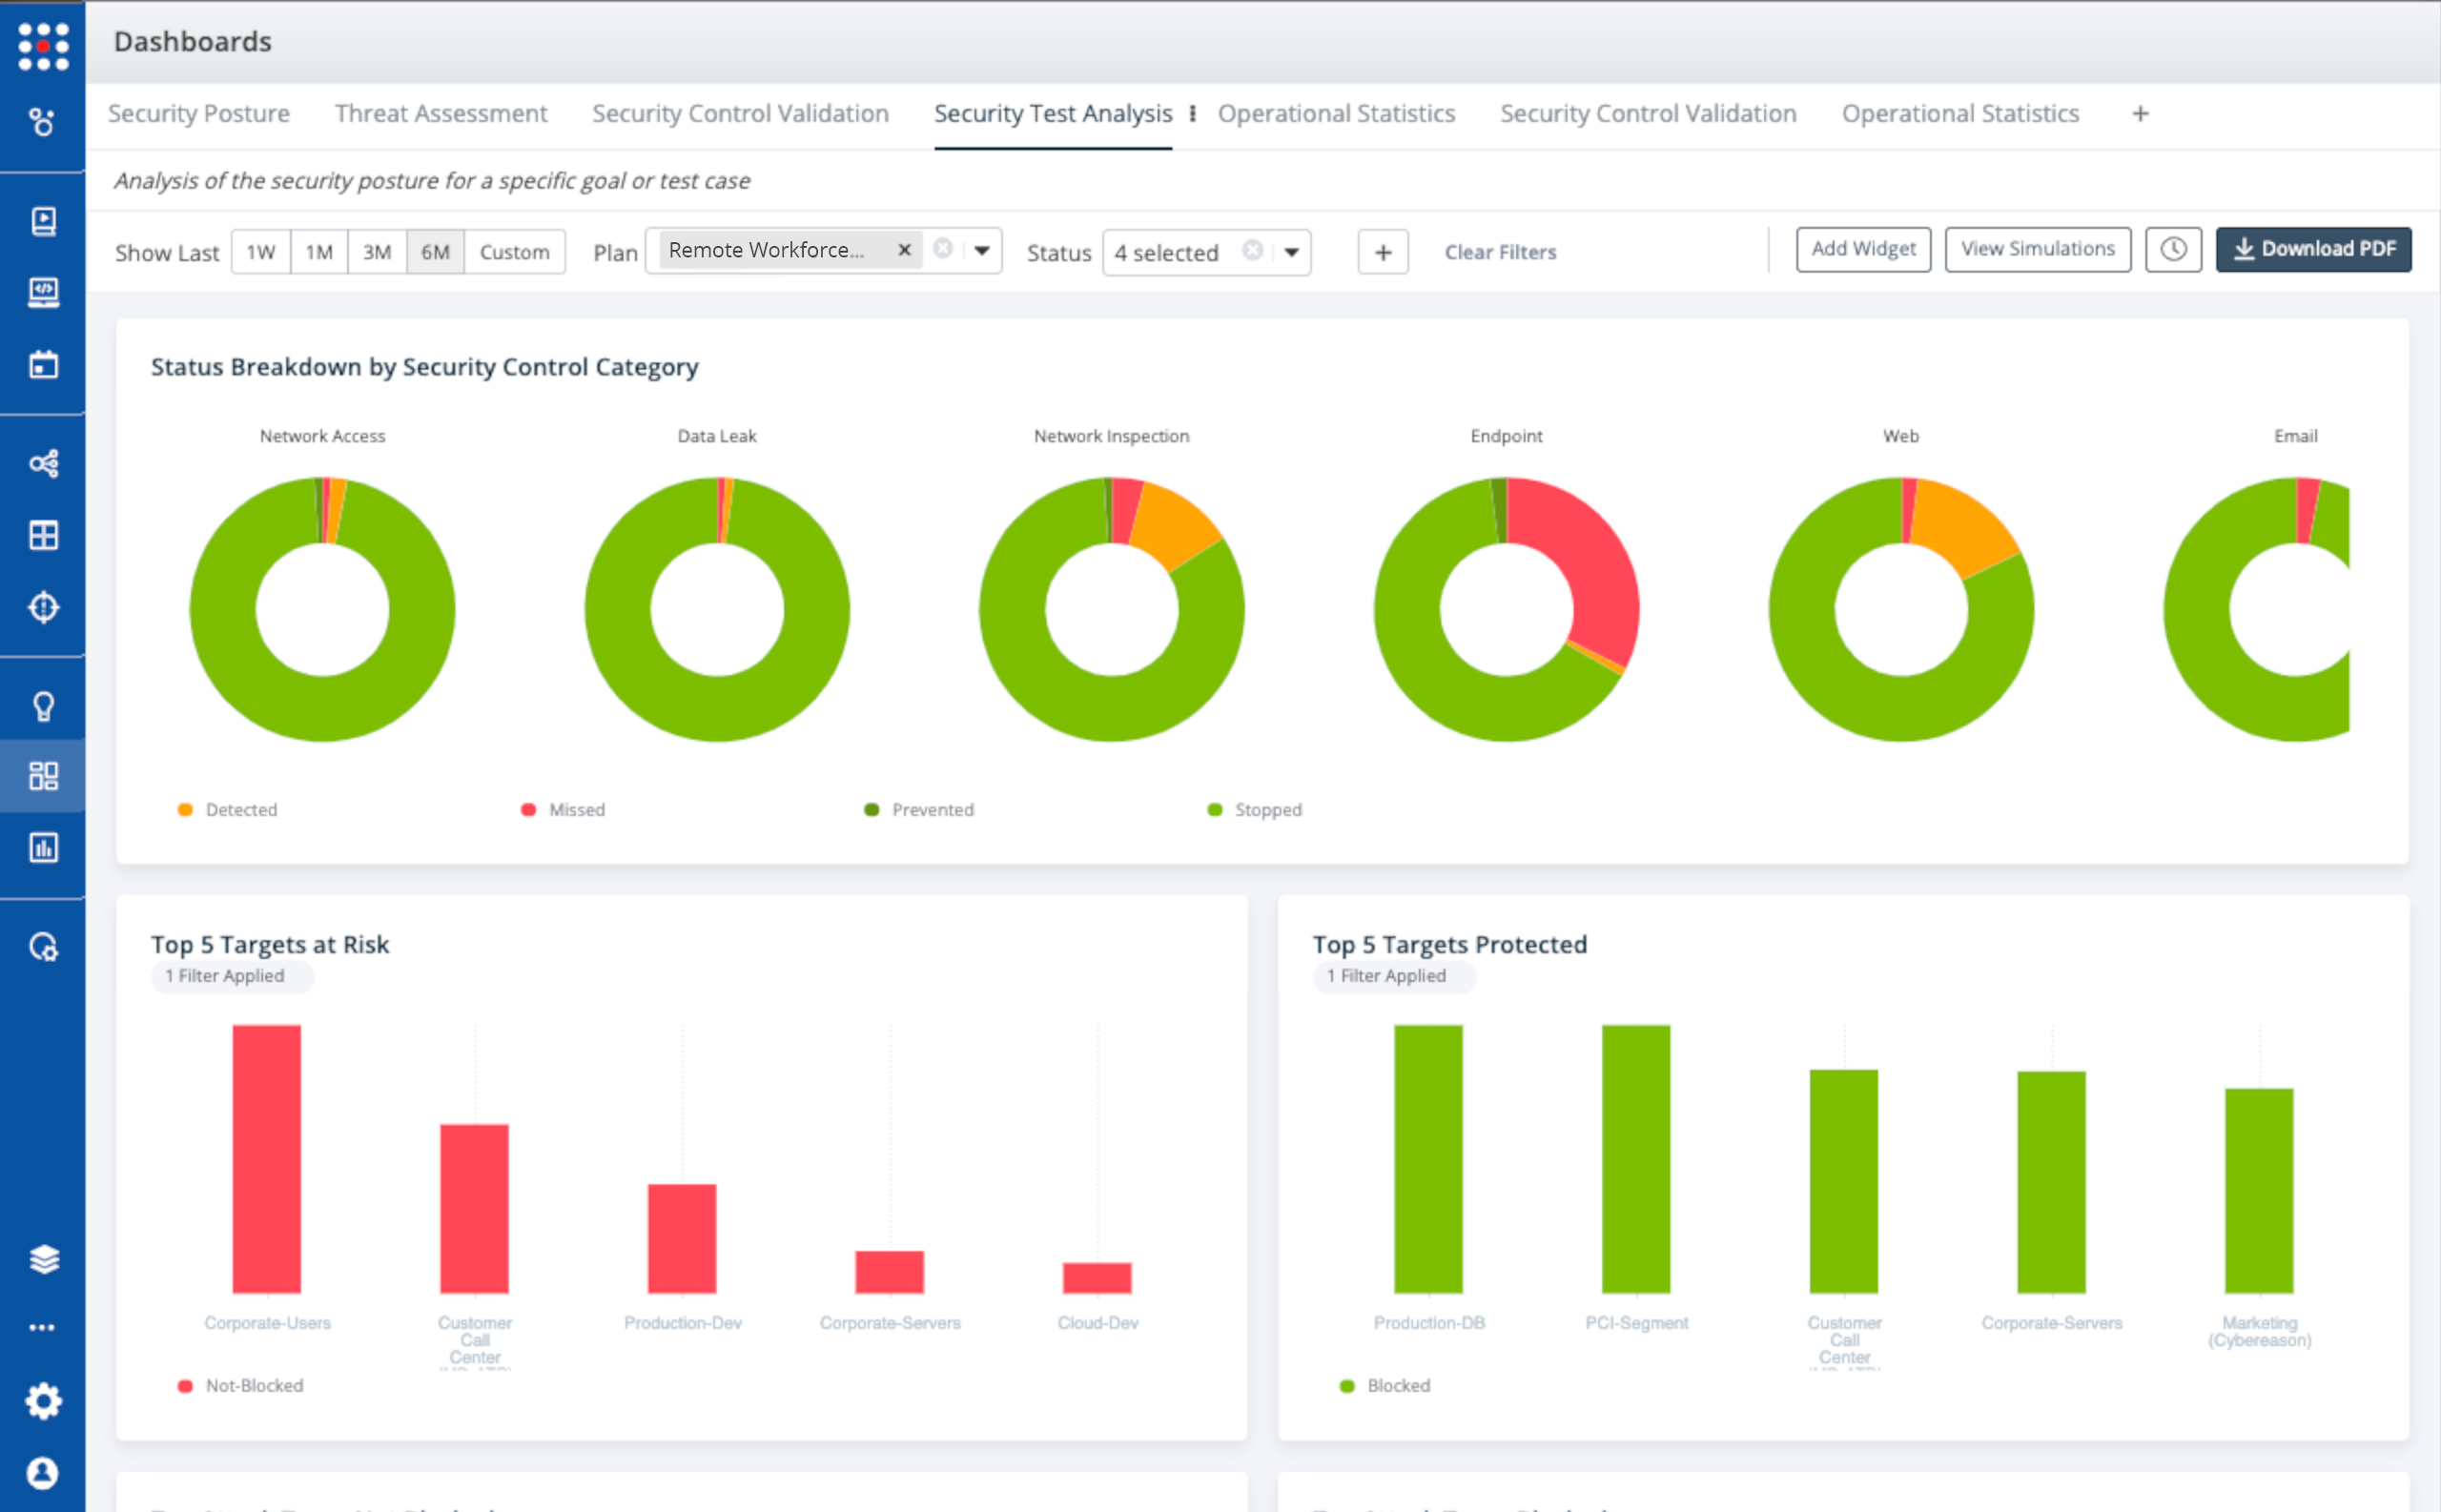
- Security Test Analysis for Remote Workforce Validation COVID-19 drove changes in the networks of multiple SafeBreach customers, leading them to dashboards to visualize and drive mitigation of resulting risks from remote work.

Conclusion: You Can’t Improve What You Can’t Visualize Or Focus On
As the scope and type of cyber risk expands, CISOs and Boards of Directors are realizing that they must do a better job of managing security and focus on what matters the most. They know they can’t boil the ocean and block everything. They also know they can’t expect stakeholders to wade through reams of charts and data to find actionable information that informs decisions and behaviors. Stakeholders that can see and constantly validate how their actions impact security and business KPIs will be empowered to improve KPI performance. SafeBreach Flexible Dashboards finally make it possible to take the abstractions out of cyber risk and deliver crisp focus that is a pre-requisite to effectively managing security risk and mapping improvements on those risks to real business metrics.
To learn more about the Dashboards and all recent releases, visit our Recent Releases page.
